Chart Your Growth with
Imagine Math®
Imagine Math’s adaptive, digital learning helps students master grade-level math and is ideal as a supplement to standards-based instruction. See how time spent in the program translated to growth in 2022–23.
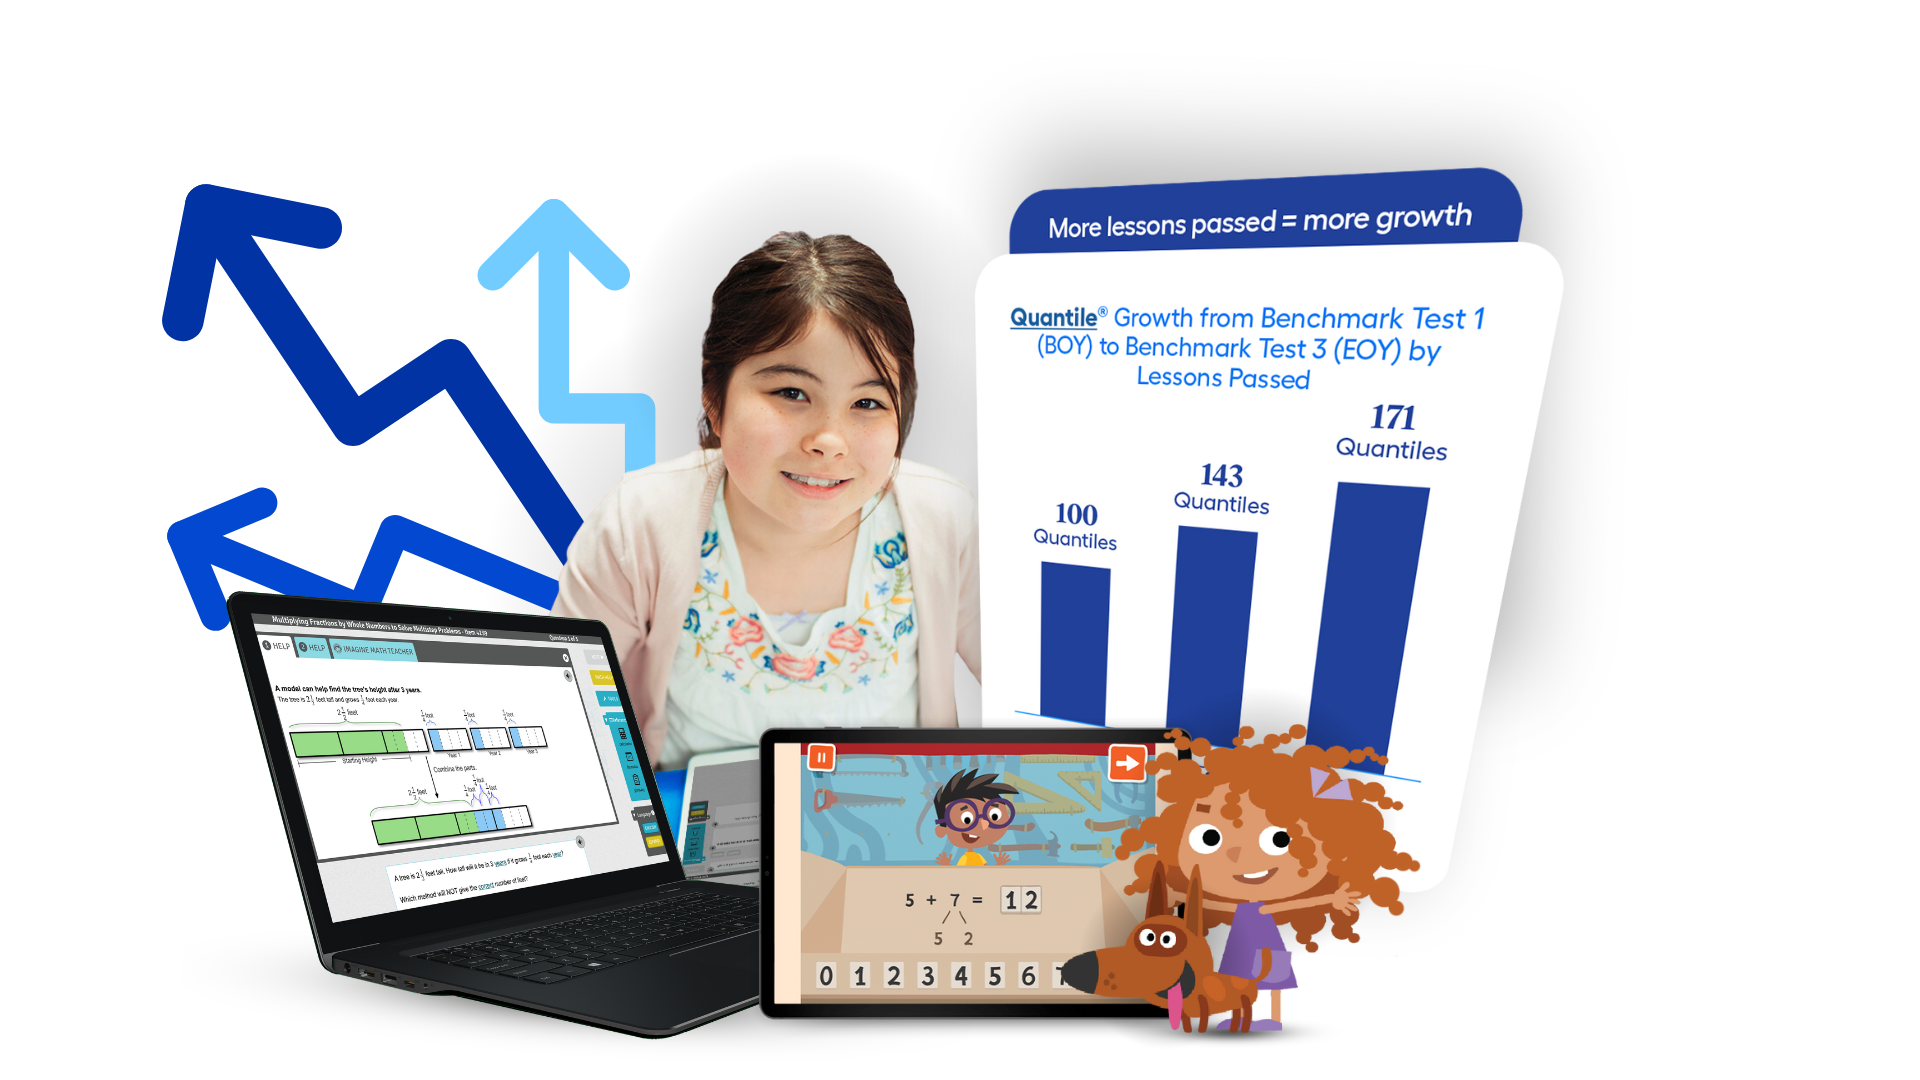
Chart Your Growth with Imagine Math
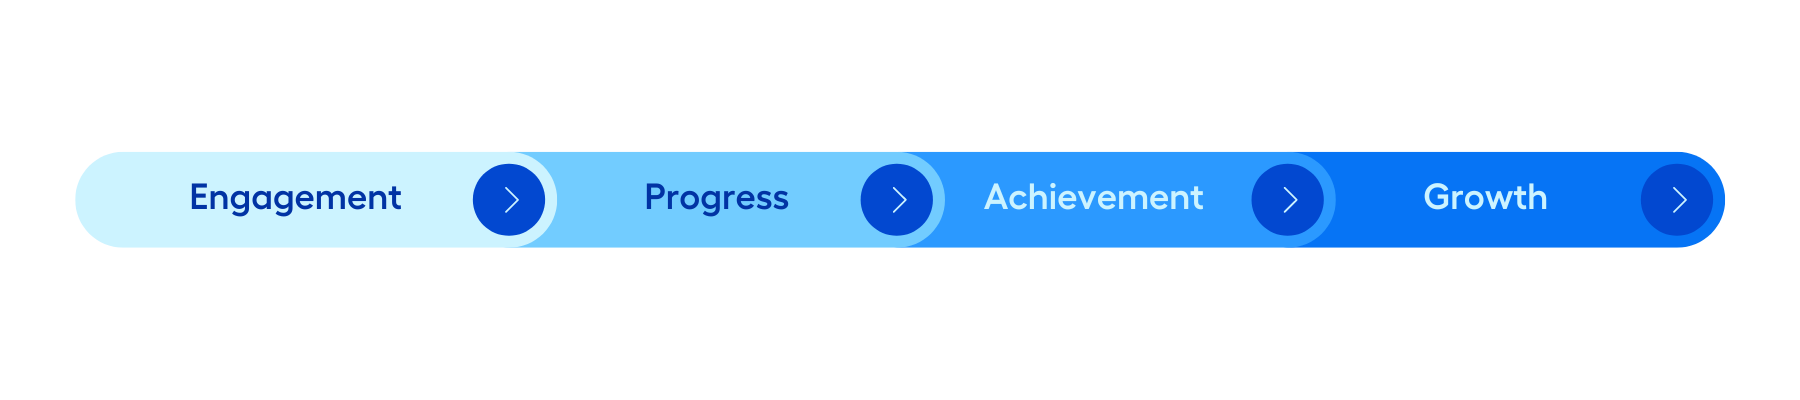
Discover the proven formula for success in Imagine Math and measure your impact on students’ outcomes from engagement through progress, achievement, and ultimately to growth. Dig in to what your usage data says and imagine what’s possible (spoiler alert: anything is possible!).
See What 30 Lessons Can Unlock
Explore data from over 1 million Imagine Math students, including yours
To optimize student learning outcomes, students are recommended to pass at least 30 Imagine Math lessons during the school year. Why? Because that’s where the growth happens!
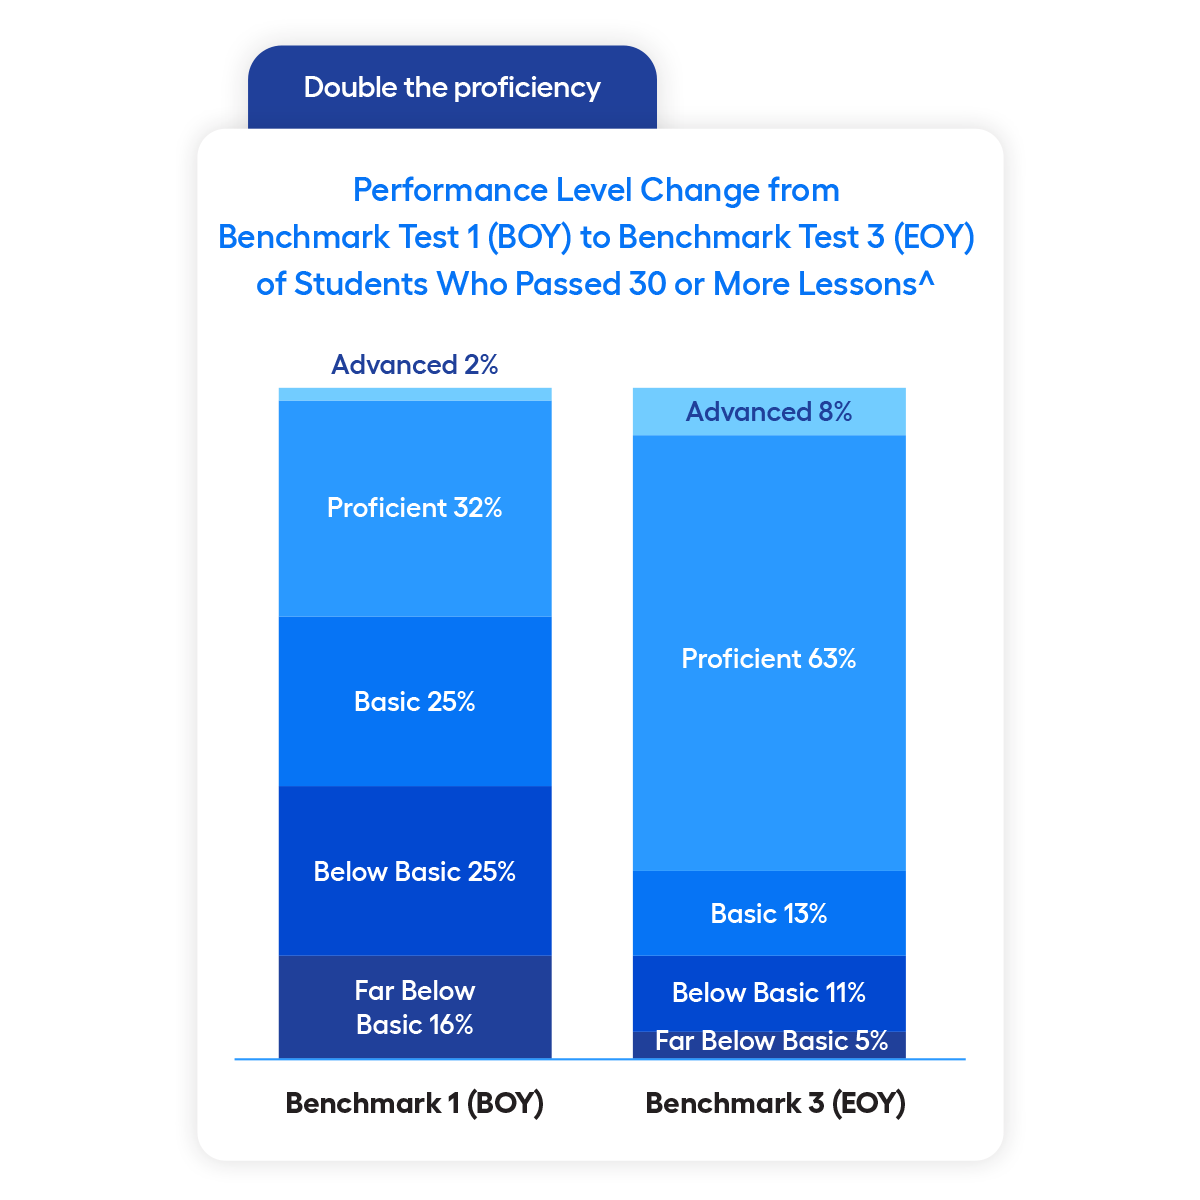
Research from the 2022–23 school year shows that when there were 30 or more lessons passed:
2x
students scored
proficient
4x
students scored
advanced
17%
fewer students scored below basic
What does YOUR data say?
See if your students passed 30 lessons and examine other opportunities for success with Imagine Math.
Help Your Students Meet the 30-Lesson Mark
Engagement
2x week for 30 mins =
30 lessons passed
Are your students active in their learning? In 2022–23, Imagine Math students earned 49 million THINK points in the program, donating $72,776 to 17 charities. Knowing they can use their learning to make a positive difference in the world helps students connect with the material.
Find details about THINK points and other engagement-boosting features in the Help Center.
Progress
Are your students on track? Encourage them to ask for Math Help Hints and utilize bilingual (English/Spanish) Live Teaching at home and school.
Nationwide, Math Help Hints were used
14,422,896
in 2022–23
Students logged
49,481 hours*
of one-on-one learning with Imagine Math Live Teachers
See how these and other features can keep students on pace for grade-level comprehension.
*Calculation based on the average Live Teaching session lasting for 6.5 minutes systemwide.
Achievement
Time spent in the program throughout the 2022–23 school year really added up:
14,422,896
total hours of learning
34,084,896
lessons passed
Are your students demonstrating content mastery?
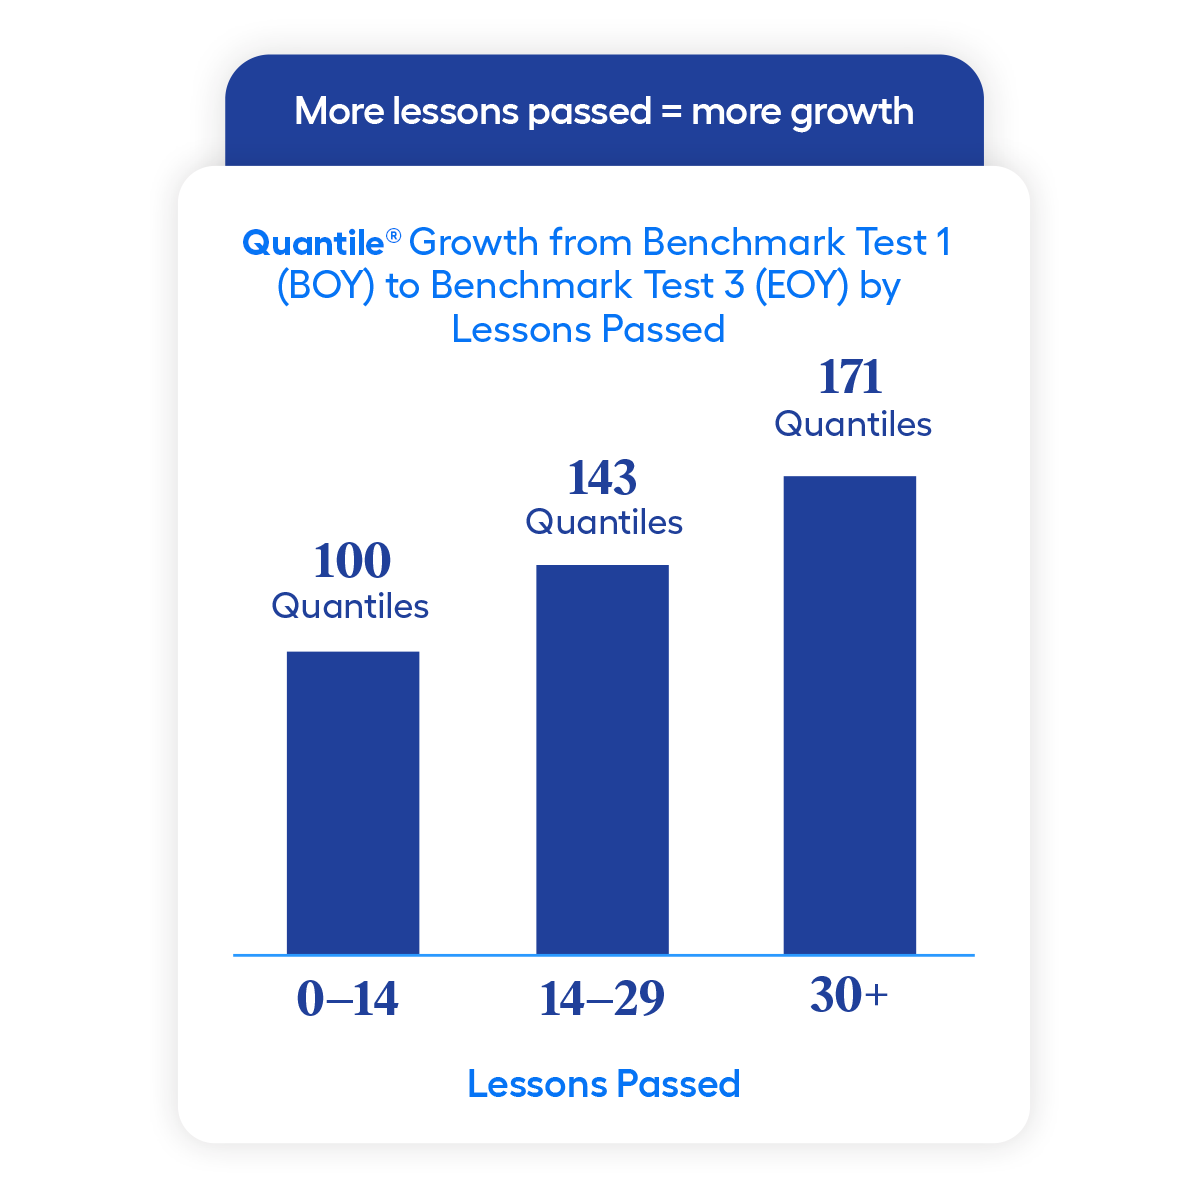
Data spanning all grade levels shows that the more time spent in Imagine Math, the more Quantile growth students experienced during the school year.
MetaMetrics has found that the expected average growth of students across the nation is in the range of 56–98 Quantiles per academic year, depending on grade level. Imagine Math students far outperform these growth expectations.
Explore your benchmark reports to see how Imagine Math contributes to your students’ Quantile growth.
Growth
Are your students growing as mathematicians?
Twice as many Imagine Math students who met the 30-lesson minimum were proficient at the end of the 2022–23 school year than at the beginning (and four times as many were advanced). Plus, research found that students who passed at least 30 Imagine Math lessons demonstrated significantly greater growth on standardized math assessments.
Discover how students’ time in Imagine Math empowers their growth.
See how your students did this year and discover what’s possible in 2024–25.
When used with fidelity, Imagine Math ignites breakthroughs and charts significant growth for students across PreK–geometry.
Privacy Policy | Terms of Use